Narrative Tool
Empower healthcare researchers to build engaging storytelling survey with ease
2023
Individual
Client: Center for Unusual Collaboration, the Netherlands
Keywords: programming, data visualisation, UI/UX design
Description
Stories have been used as a resource in design. They are a great way to put user values center stage, and to develop technology solutions that prioritise those values. However, design stories and scenarios are often constructed within the design studio, or with a limited set of users.
This project aims to design and develop a narrative tool that empowers researchers to build engaging storytelling surveys with a simplified workflow while also providing a user-friendly dashboard for visualising and tracking participants' responses.
This project aims to design and develop a narrative tool that empowers researchers to build engaging storytelling surveys with a simplified workflow while also providing a user-friendly dashboard for visualising and tracking participants' responses.
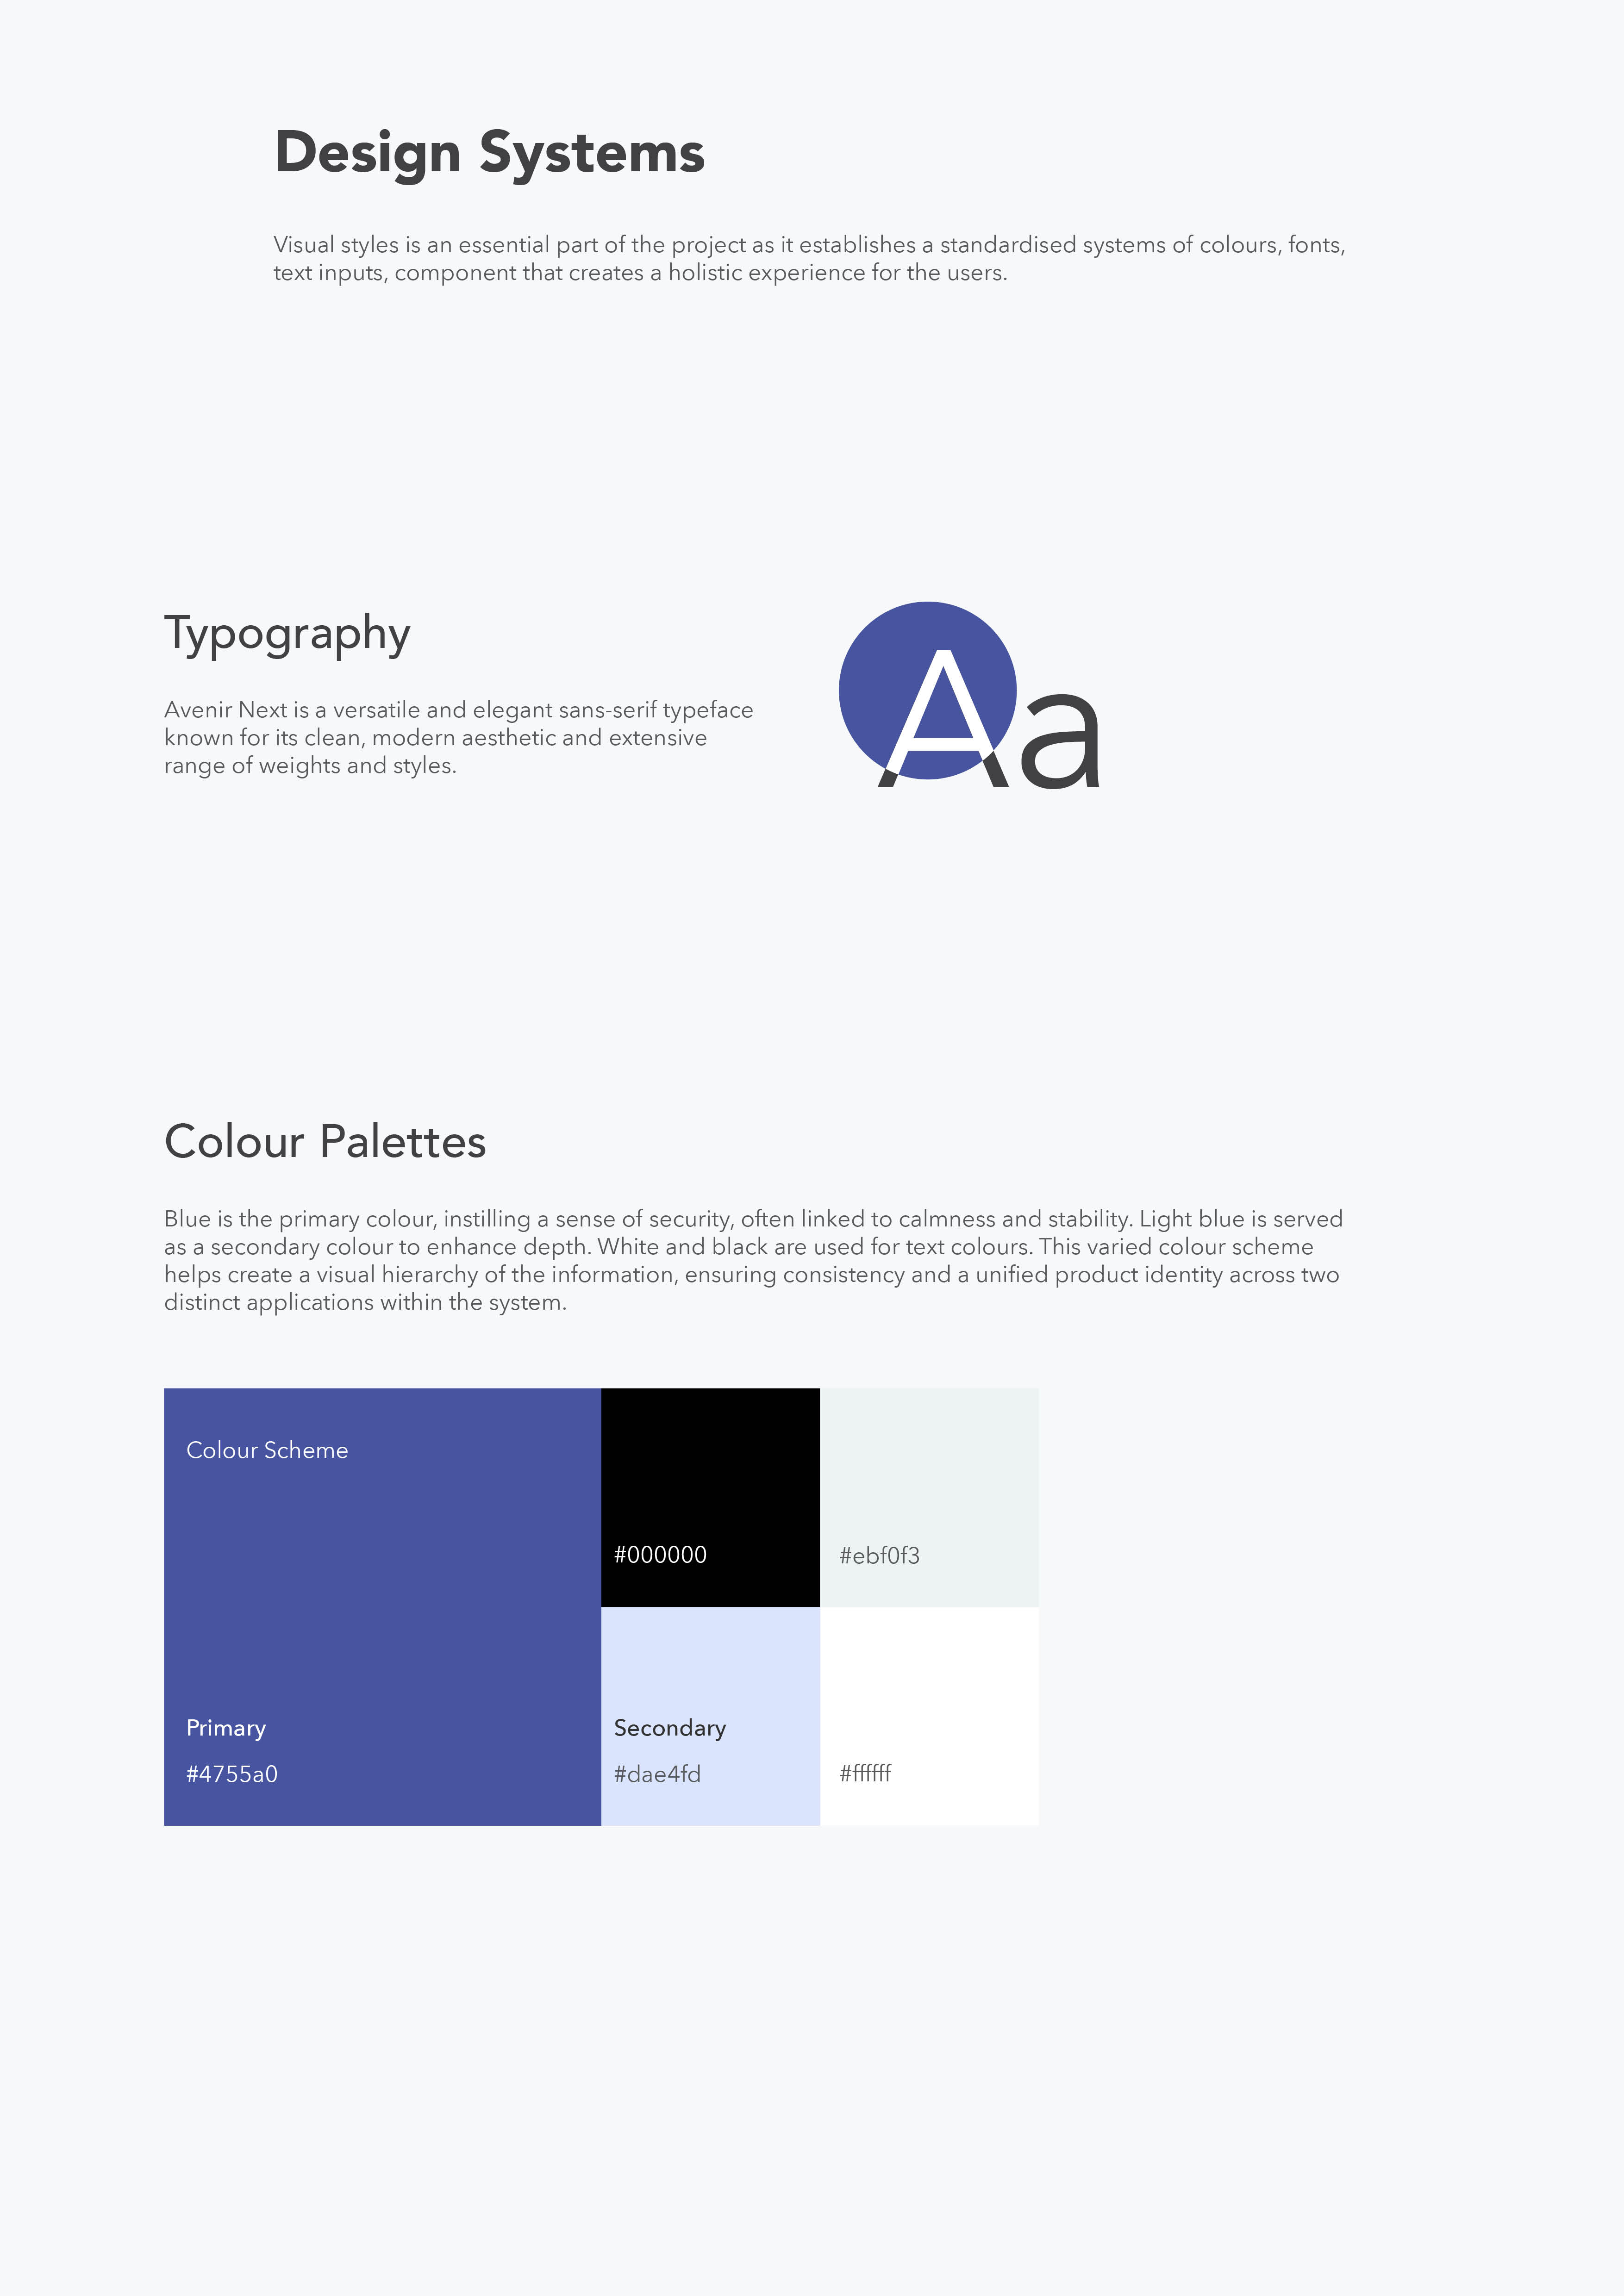
Design System

Constructing Narrative Stories
I have selected Twine, an open-source tool designed for creating interactive and nonlinear narratives, as a foundation. The interface is then refined with customised css based on requirements from the clients.
Data Tracking and Visualisation
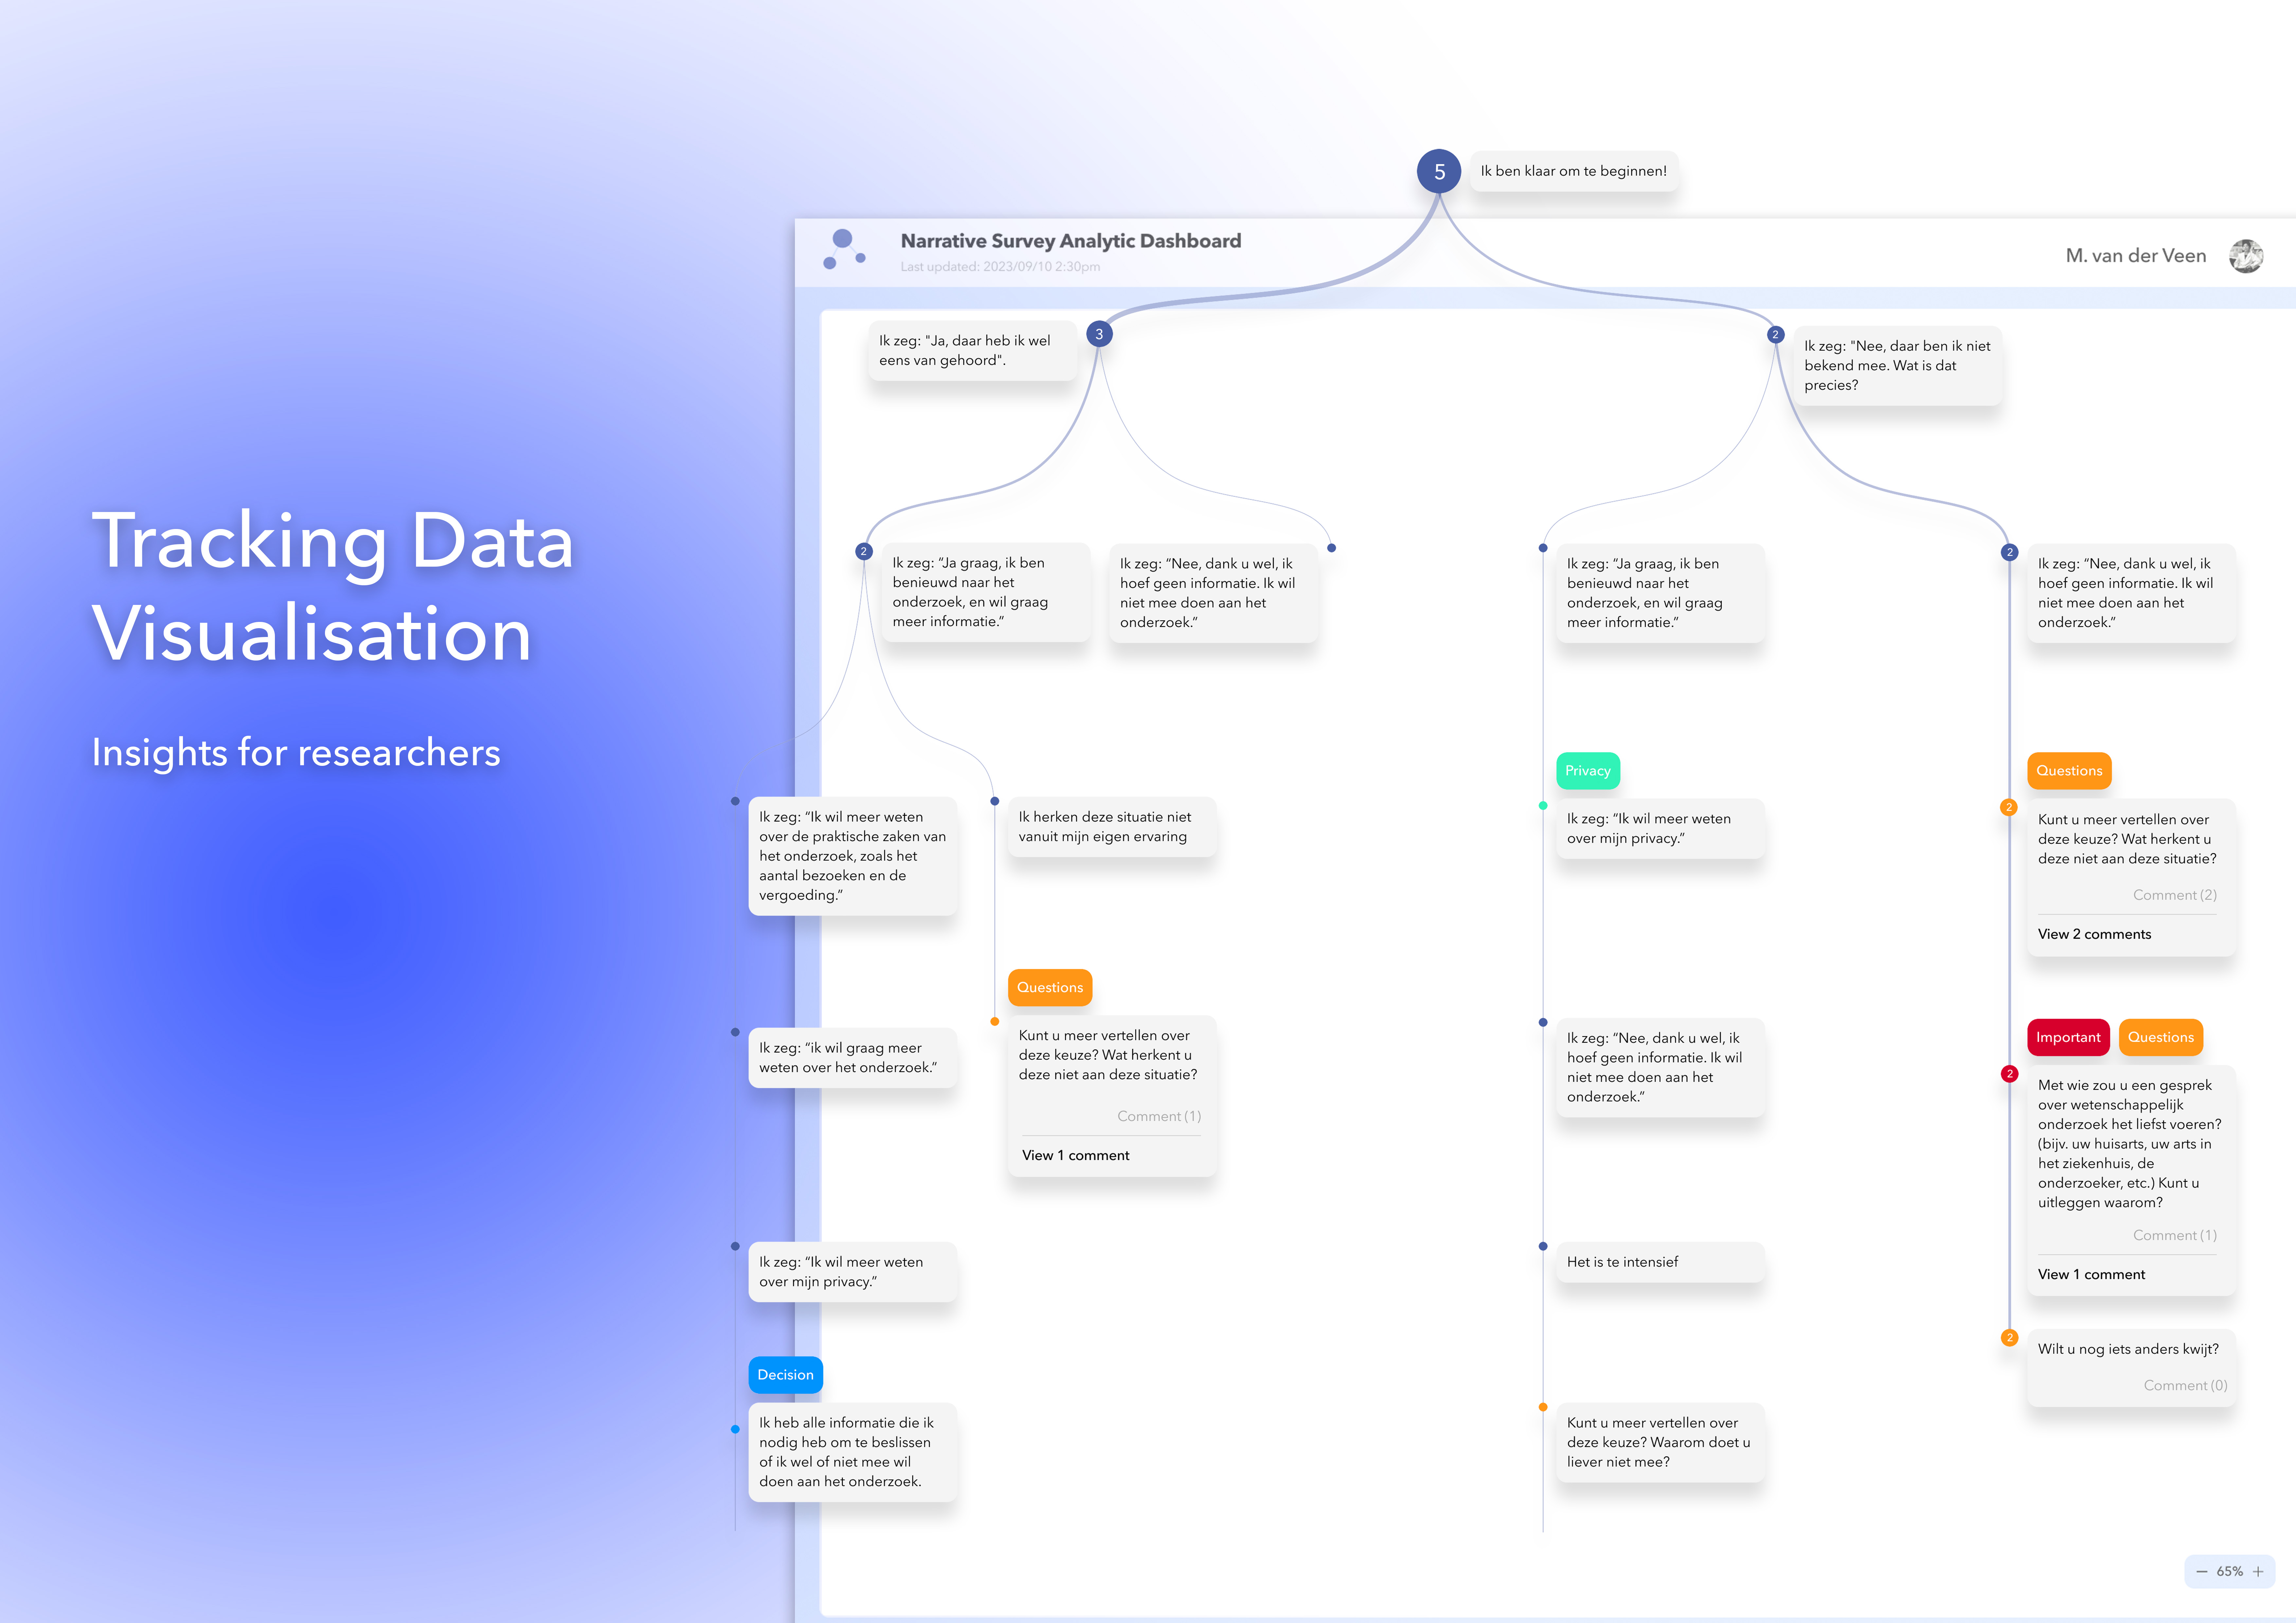
Every decision made by the participants within the story is monitored and transferred to a server. The dashboard then utilises this tracking data and presents it in a comprehensible way for the researchers.
I selected tree structures to represent the tracking data, in accordance with the structure of a narrative survey. Each distinct pathway is depicted individually or merged with others when they overlap. The size of the circles corresponds to the number of participants who chose a specific option, and comments were collected and categorised as well.
Technology wise, this dashboard is developed with Javascript, the React framework and CSS. A data visualisation library from D3.js was utilised, along with breadth-first search (BFS) algorithms to navigate traverse and merge data in a tree structure. The source code for this project can be found in my GitHub repository
I selected tree structures to represent the tracking data, in accordance with the structure of a narrative survey. Each distinct pathway is depicted individually or merged with others when they overlap. The size of the circles corresponds to the number of participants who chose a specific option, and comments were collected and categorised as well.

Technology wise, this dashboard is developed with Javascript, the React framework and CSS. A data visualisation library from D3.js was utilised, along with breadth-first search (BFS) algorithms to navigate traverse and merge data in a tree structure. The source code for this project can be found in my GitHub repository